
")
Cera Sanitaryware Share Price (Trends in the Market) – 5,216.40 per share as of the 11th of February, 2026 on the NSE/BSE. This is a decrease of 1.35% from the last close.
Cera Sanitaryware Limited is in the home improvement and building products industry in India, which is plagued with structural trends of long term, like urbanisation, growing household incomes and making lifestyle-based home upgrades more popular. Unlike the discretionary luxury items, sanitaryware and bathroom fittings have much better demand as mandated in residential and commercial development. Cera has over the years established itself as a quality and profitability company and opted to go the consistent execution rather than aggressive growth.
This article will provide complete information about Cera Sanitaryware share price.
Cera Sanitaryware Ltd: Company Overview
Cera Sanitaryware Limited deals with production, commerce, and sale of sanitaryware and complementary building products. What started as a company dealing with sanitaryware has now become a full-fledged bathroom solutions company and they have products that can satisfy various consumer needs and price range.
The company has three different brands with its main brands being CERA, CERA Luxe and Senator, which are supposed to target a particular customer segment. Whereas CERA caters to the mass-premium segment, CERA Luxe targets a luxury residential and upscale commercial developments, and Senator targets a few premium segments.
Besides its direct manufacturing business, Cera has wind and solar power plants to serve as captive users in the state of Gujarat where it aims to cut the long-term power expenses and enhance sustainability. On 11 February (close) the company shares are trading at 5216 with a market capitalization of approximately 6729 crore.
| Item | Details |
| Company Name | Cera Sanitaryware Limited |
| Sector | Consumer Durables – Sanitaryware |
| Current Share Price | ₹5,216 |
| Market Capitalisation | ₹6,729 Cr |
| Face Value | ₹5 |
Cera Sanitaryware Li: Product Portfolio and Brand Architecture
One of the strongest competitive advantages that Cera has is its product portfolio. The company has developed a multi-product infrastructure based on the bathroom and kitchen area instead of focusing on one category. This enables Cera to augment wallet share per client and affiliate the dealer relations through cross-selling.
The products offered by the company are sanitaryware, faucetware, tiles, wellness like bathtubs, shower enclosures, kitchen sinks, and mirrors. This wide range of products lowers the reliance on any cycle of specific products and helps to achieve more stable revenues in any market environment.
| Category | Key Offerings |
| Sanitaryware | Toilets, basins |
| Faucetware | Taps and fittings |
| Wellness | Bathtubs, enclosures |
| Tiles | Floor and wall tiles |
| Kitchen & Mirrors | Sinks and accessories |
Industry Landscape and Competitive Positioning
The sanitaryware business in India involves organised and unorganised players but the organised segment is taking over because of the increased quality standards, branding and compliance with regulations. Established brands such as Cera enjoy a sense of trust, distribution and uniformity of the products.
The competitive positioning of Cera aims at high quality of products and discipline in operations, instead of fast volume growth. This has allowed the company to have better margins and returns ratios than many of its peers though at the expense of slower top-line growth.
| Company | CMP (₹) | P/E | Market Cap (₹ Cr) | ROCE |
| Cera Sanitaryware | 5,216 | 29.9 | 6,729 | 22.4% |
| Hindware Home Innovation | 241 | NA | 2,015 | 3.6% |
| Ganga Bath Fittings | 19 | 27.6 | 42 | 27.6% |
Cera Sanitaryware Share Price (Current)
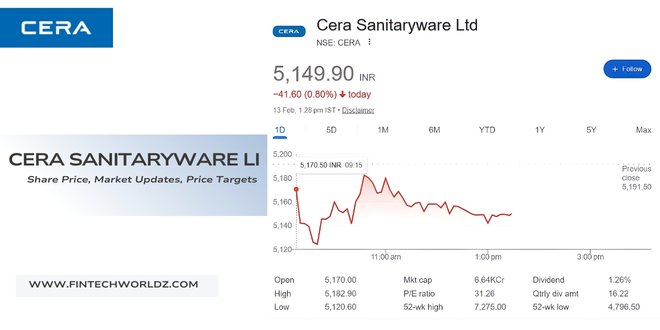
By the beginning of the first week of February 2026, Cera Sanitaryware was trading at approximately 5,221, and it is making a gain of some 1.23 percent since the last close of 5,158. The movement in one day of the last few sessions indicates that the price has been varying between 5068 and 5303 with day high of about 5344 and day low of about 5145. The market capitalisation of the company is approximated to be ₹6,680-6,800 crore and the company stock is currently trading at 28.5 P/E ratio. Its 52-week price range is 5,060 to 7,739 indicating a recent downward pressure of the top prices.
| Metric | Value |
| Current Price | ~₹5,221 |
| Previous Close | ₹5,158 |
| Day High | ~₹5,344 |
| Day Low | ~₹5,145 |
| Market Cap | ₹6,680–₹6,800 Cr |
| P/E Ratio | ~28.47 |
| 52-Week High | ₹7,739 |
| 52-Week Low | ₹5,060 |
Cera Sanitaryware Price Targets (2026–2030)
The various projections of price targets of Cera Sanitaryware are diverse based on assumptions on the growth, margins of the sector and valuation multiples. Optimistic forecasts (such as those averaged in short-to-median term) include values of 8800 to 9100 on or before 2026, with a technical indication and recovery prospects in the sector. There are also higher long-term forecasts that go way up with the basis of a continued increase in demand of the housing and premium bathware but these are speculative. Recent coverage has an analyst consensus leaning towards a Bias to Buy with a 1 year target range around ₹7,900 -8,400.
| Year | Low Target | Mid / High Target |
| 2026 | ₹10,199 | ₹12,979 |
| 2029 | ₹22,976 | ₹29,237 |
| 2030 | ₹30,120 | ₹38,327 |
Note: These targets are suggestive and reflect on the growth of earnings, the market, and performance of the sector.
Cera Sanitaryware IPO History and Background
The company history of Cera Sanitaryware started in 1998 as Madhusudan Oils and Fats Ltd. It then changed its direction to sanitaryware and in December 2002 it was renamed Cera Sanitaryware Ltd. It later got a chance to enter the capital markets in the year 2007 with its main IPO and was formally listed in the Indian stock markets. IPO made Cera a well known name in the ceramics and building construction industry with its production being located in Gujarat.
| IPO Aspect | Details |
| Original Name | Madhusudan Oils and Fats Ltd |
| Incorporation Date | 17 July 1998 |
| Renamed | December 2002 |
| Main IPO Year | 2007 |
| Business Focus | Sanitaryware & building products |
Cera Sanitaryware NSE and BSE Listing Details
The Cera Sanitaryware actively trades in both the major exchanges in India. In the NSE, it is listed as CERA and in BSE, the stock is listed as code 532443. The equity share ISIN is INE739E01017, and share face value is 5INR. The stock belongs to a number of major indices such as the BSE-100, BSE-200, S&P CNX 500, CNX Midcap, and other broad market indices, indicating that the stock is a well-established mid-cap company.
| Listing Detail | Information |
| NSE Symbol | CERA |
| BSE Code | 532443 |
| ISIN | INE739E01017 |
| Face Value | ₹5 |
| Major Indices | BSE-100, BSE-200, CNX Midcap |
Cera Sanitaryware Li: Company Buyback Activity
Cera Sanitaryware failed to release a new IPO in 2024. The company instead undertook a tender offer buyback as a capital allocation and shareholder return strategy. The buyback involved a period between 22-28 August 2024 and was by way of 1,08,333 shares at 12,000 per share which amounted to around 130 crore total. The buy back price was a huge premium relative to the market price, which existed at the time. It was dated 16 August 2024, and shares were extinguished by 13 September 2024.
| Buyback Parameter | Details |
| Buyback Period | 22–28 Aug 2024 |
| Buyback Price | ₹12,000 per share |
| Shares Bought Back | 1,08,333 |
| Total Amount | ~₹130 Cr |
| Record Date | 16 Aug 2024 |
| Nature | Tender offer (no new IPO) |
Valuation Analysis
Cera is currently priced at a multiple of approximately 29.9 on a P/E in the current market price and this is a reasonable price of a consumer durable company with high ratios of returns and dividends being paid regularly. The stock is trading at about 4.9 times stock value, which is backed by good profitability and low leverage. The yield of 1.25 percent on dividends is an impressive figure in the industry, which reveals the interest of the management in shareholder payouts despite investing in supporting internal expansion.
| Metric | Value |
| P/E Ratio | 29.9 |
| Book Value | ₹1,063 |
| Dividend Yield | 1.25% |
| ROCE | 22.4% |
| ROE | 18.3% |
Cera Sanitaryware company Revenue Growth Trend
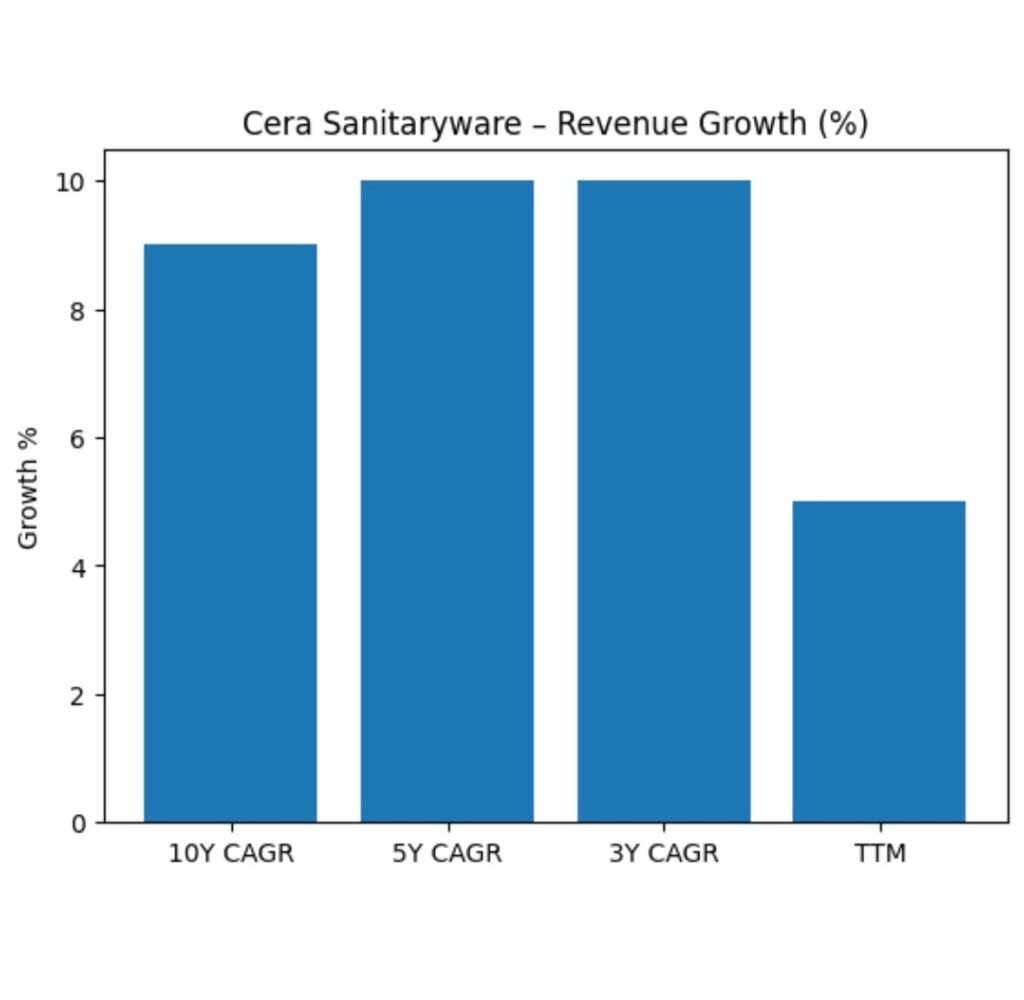
The trend of revenue growth in Cera may be said to be stable as opposed to aggressive. The sales also rose by 664 crore during the years FY14 to 1,915 crore during the year FY25 and the TTM sales during the year stands at 1,984 crore. A growth rate of about 9-10 percent CAGR is an indication of a conscious policy of focusing on margins and balance sheet strength, rather than fast growth. Such a strategy reduces the upside as the housing markets boom, but also the downside risk when the markets slow down.
| Period | Growth |
| 10-Year CAGR | 9% |
| 5-Year CAGR | 10% |
| 3-Year CAGR | 10% |
| TTM Growth | 5% |
Cera Sanitaryware company Profit Growth Trend
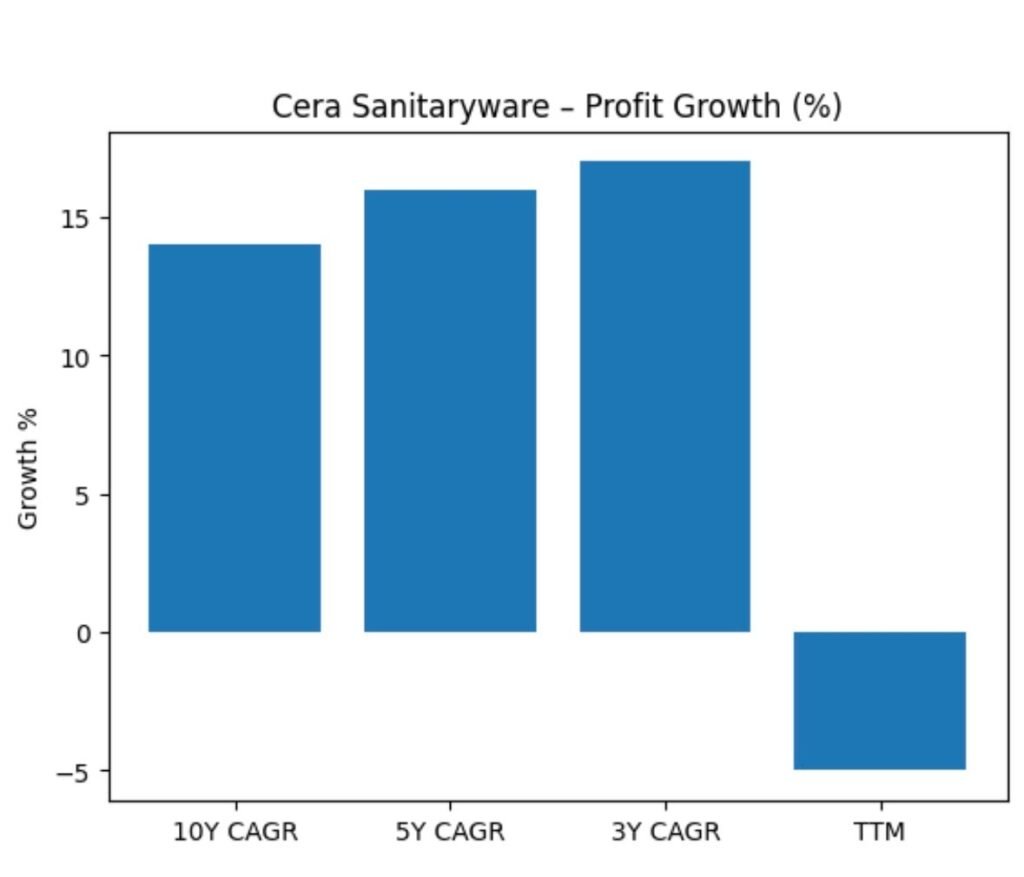
The operating leverage and cost control has pushed the growth in profit over the long term to be greater than revenue growth. Net profit increased to 246 crore in FY25 up to 52 crore in FY14. Nevertheless, TTM profit fell by 5% indicating that there was short-term margin or cost pressure. This is a new slump that has played a central role in investor apprehension.
| Period | Growth |
| 10-Year CAGR | 14% |
| 5-Year CAGR | 16% |
| 3-Year CAGR | 17% |
| TTM Growth | −5% |
Cera Sanitaryware Quarterly Performance Analysis
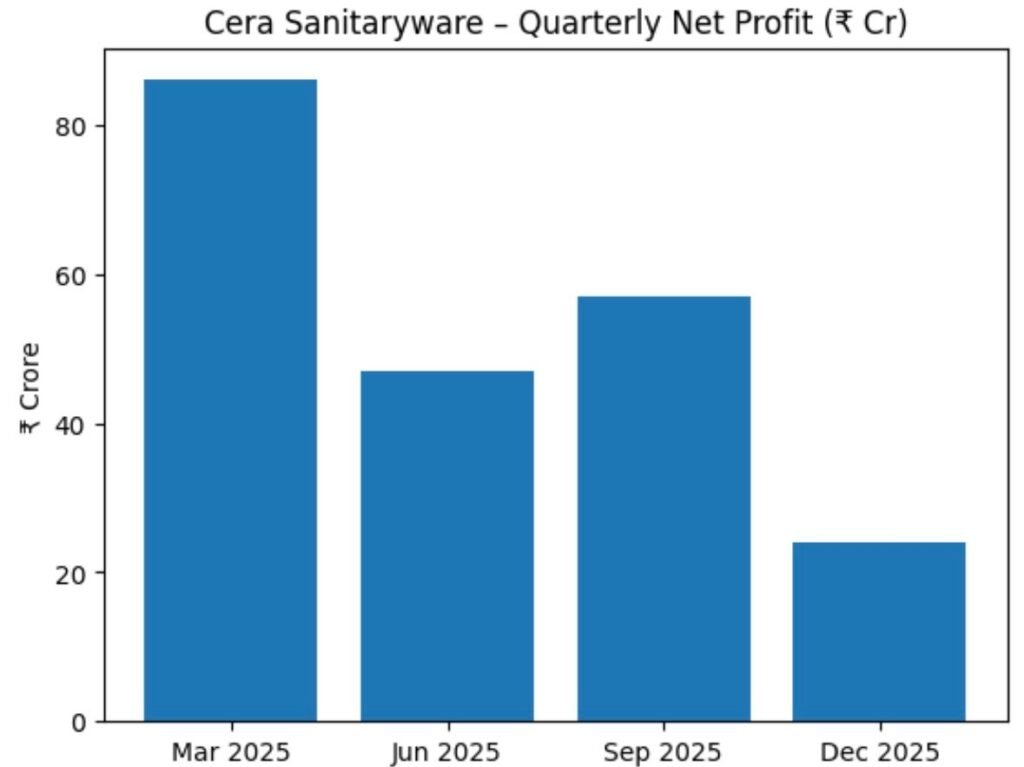
The margins and profits in the quarterly performance are not stable, which indicates the input costs are not stable and seasonal. Although sales show a comparatively stable situation, the operating margins have decreased significantly pointing at 10% in the December 2025 quarter since this is well below the historical averages. Such a downturn should be carefully observed to know whether it is cyclical or structural.
| Quarter | Sales (₹ Cr) | Net Profit (₹ Cr) | OPM |
| Mar 2025 | 578 | 86 | 18% |
| Jun 2025 | 419 | 47 | 13% |
| Sep 2025 | 488 | 57 | 14% |
| Dec 2025 | 499 | 24 | 10% |
Cera Sanitaryware share Margin Analysis
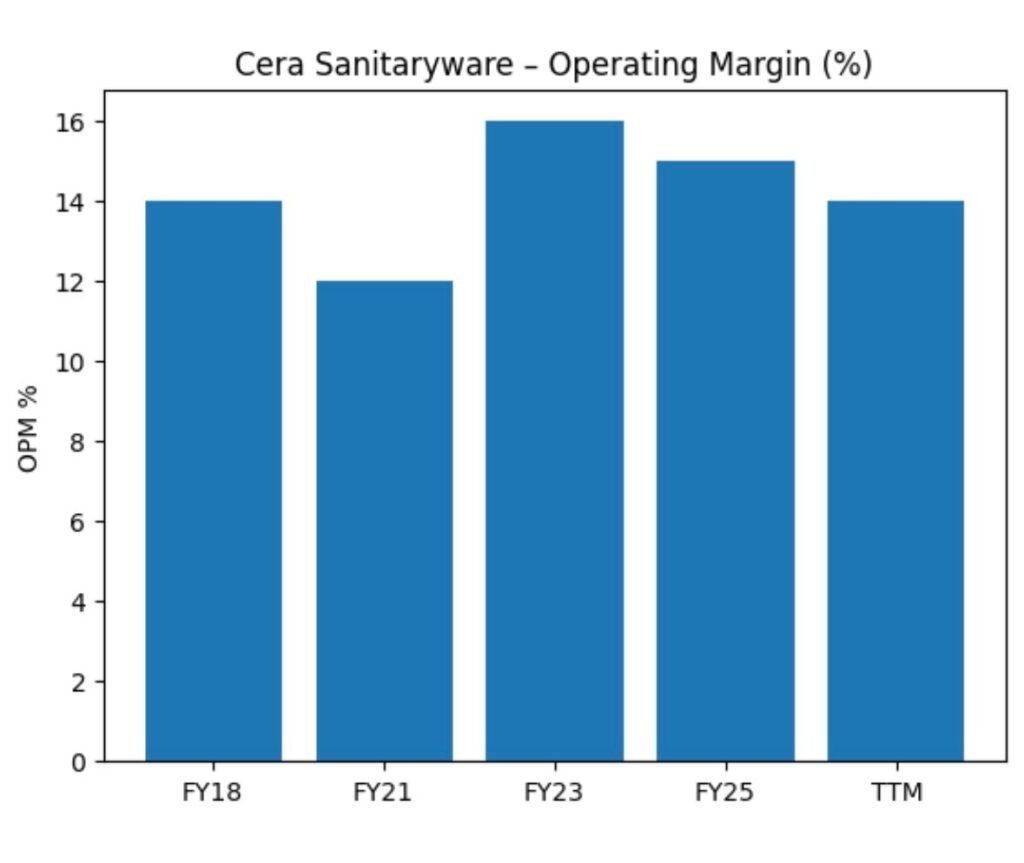
In the past, Cera operated at operating margins between 14 and 17 percent which indicated an efficient operation at a premium price. The new narrowing down of the margin raises concerns on the inflation of raw materials, competitiveness in offering discounts, or the increased cost of operations. Recovery of margin will be essential to maintain the ratios of returns and valuation multiples.
| Year | OPM |
| FY18 | 14% |
| FY21 | 12% |
| FY23 | 16% |
| FY25 | 15% |
| TTM | 14% |
Balance Sheet Strength
The balance sheet of Cera is conservative and strong. The borrowing is minimal and the reserves are more than 1300 crore. The investments constitute a significant part of assets, and this gives liquidity and financial flexibility. This is a strength of the balance sheet that enables the company to survive economic slowdowns without affecting dividends or expansion strategies.
| Item | ₹ Cr |
| Total Assets | 1,841 |
| Reserves | 1,344 |
| Borrowings | 63 |
| Fixed Assets | 380 |
| Investments | 702 |
Cash Flow Analysis
There has been a consistently good operating cash flow which evidences the quality of earnings. Whereas investing cash flows reveal continuous capex and investments, financing cash flows consist primarily of a dividend pay out and small amounts of debt servicing. In general, the operations and shareholder payments are comfortably funded using internal accruals.
| Year | CFO | CFI | CFF |
| FY23 | 156 | -101 | -59 |
| FY24 | 228 | -140 | -80 |
| FY25 | 116 | 128 | -258 |
Working Capital Efficiency
The intensity of working capital has been rising slowly. The inventory days increased to 163 days and the cash conversion cycle was increased to 137 days. This is an indication of the wide range of products offered and dealer-based model of distribution in the company.
Efficient inventory control will be very important in ensuring that there is stability in cash flow.
| Metric | Days |
| Debtor Days | 51 |
| Inventory Days | 163 |
| Payable Days | 77 |
| Cash Conversion Cycle | 137 |
Return Ratios and Capital Efficiency
Cera is still providing high capital efficiency although the growth has slowed down. ROCE of 22.4% and ROE of 18.3 are still very high compared to the cost of capital. But the two metrics have shown a decrease in their previous highs and this indicates diminishing marginal returns to incremental investment.
| Metric | Value |
| ROCE | 22.4% |
| ROE | 18.3% |
| 5-Year ROE Avg | 17% |
Shareholding Pattern Analysis
The holding of the promoters has not been decreasing, and it has stood at approximately 54.4 which is a sign of long dedication. FIIs were slowly pulling out exposure and DIIs were adding up to above 14 per cent indicating domestic institutional confidence. Shareholding in retail is not very volatile, showing that there is no high speculation.
| Category | Holding |
| Promoters | 54.41% |
| FIIs | 14.61% |
| DIIs | 14.01% |
| Public | 16.93% |
Strengths and Risks
Cera’s strengths lie in brand equity, capital efficiency, and dividends. Risks stem from slower revenue growth, margin compression, and inventory-heavy operations.
| Strength | Impact |
| Strong brands | Pricing resilience |
| High ROCE & ROE | Efficient capital use |
| Dividend consistency | Shareholder returns |
Conclusion
Cera Sanitaryware is a low growth, quality-based, consumer durable business as opposed to a high-growth story. It is conducive to its conservative growth strategy, good balance sheet, and stable dividends that render it to be the investment of choice to an investor who wants durability and capital efficiency. The recent decline in increases in profit and compression in the margin curtails the upside in the near term. The long term performance will rely on the capacity of the company to regain margins, effectively manage the working capital and selective acceleration of its growth without reducing the ratios of returns.
FAQs
Cera sanitary care produces and markets sanitaryware and other building products including faucets, tiles, wellness products, kitchen sinks, and bathroom accessories.
Cera Sanitaryware is nearly debt free and its borrowings are very low in relation to its reserves and it has high internal cash generation.
The stock was primarily corrected by the fact that the sales growth slowed, the margin pressures were experienced in the recent past and generally the mid-cap consumer durable stocks were weak not because the business collapsed.
Yes, Cera Sanitaryware has a good dividend payout and the yield of the dividends is approximately 1.25.
The main risks are expected to be small increase in revenue, a growth in inventory, and strain on operating margins.